Amateur Astronomy: Finding Ultra-High Redshift Galaxies
Here is one method for finding ultra-high redshift galaxies from among the thousands of blobs of light in Hubble images.
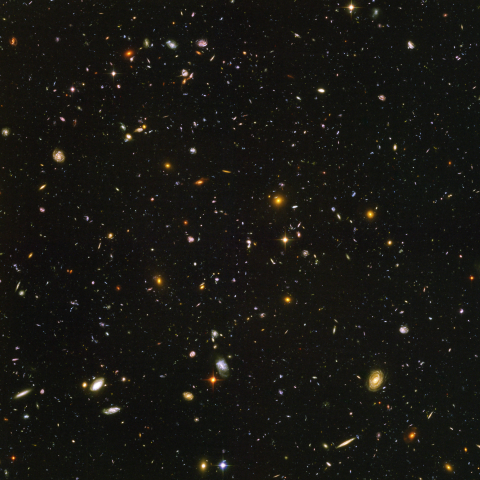
On his blog, Starts with a Bang, Dr. Ethan Siegel posted two Hubble Ultra Deep Field images, one in visible light and the other in infrared light, and posed a sort of challenge:Any galaxy hunters out there are free to go to the old HUDF and the new HUDF images and see what you can find.
Since I have done some image comparison before, I could hardly pass this up.
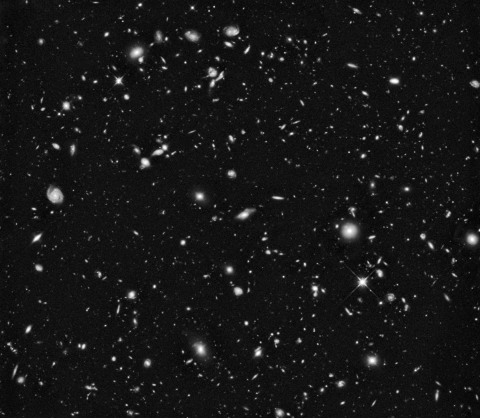
First, here is the visible-light image (you can click almost all of these to get full-sized images, but they are very large):
And here is the infrared image:
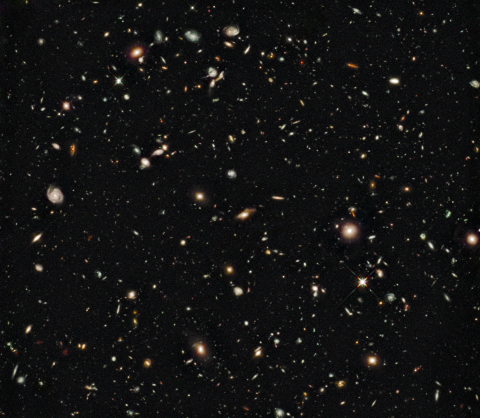
Now, I could tell right away that this wasn’t going to be a straight-forward task, since the infrared image is smaller than the visible image, so at the very least it was going to take some effort to discover just where to overlay the smaller on the larger to do some comparisons.
Anyway, the trick here is that the farther galaxies are from Earth, the more redshifted they appear. Galaxies that are really far away become so redshifted that they become completely invisible in the visible spectrum of light. (You can read all about this phenomenon on Wikipedia.) So to find galaxies which are really, really far away, we just need to look for blobs of light in the infrared image which are absent from the visible-light image. Really, since the “background” in the images isn’t absolutely black (due to a variety of reasons), what we need to look for are groups of pixels (blobs) in the infrared image which are significantly brighter than the corresponding pixels in the visible image.
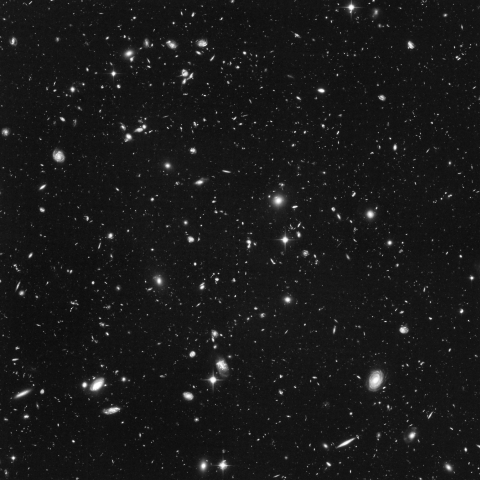
The first step in doing so is to convert the images to grayscale. We don’t need color information, we just need to know the brightness of each pixel. Now, if we do this with the standard “convert to grayscale” functions in commercial image-processing programs, they will tend to try to mimic how the human eye perceives color brightness, by taking a certain percentage of the red, green and blue values for each pixel to calculate a reasonable approximation of grays for the colored pixels. But we don’t actually care about recreating the “proper” brightness (especially since the colors in the infrared image are fake, anyway, and don’t correspond to any human-sensible band of light), what we are interested in is the raw brightness of the pixels in only two bands, visible and infrared. So instead of doing the calculations for human vision, I simply took the brightest value (red, green or blue) for each pixel and made the gray version equally bright. The visible light image in grayscale:
And here is the infrared version:
Okay, so now we have to match up the images. First, I just plopped down the infrared image on the visible image at an arbitrarily decided offset of 80 pixels horizontally (X) and 80 pixels vertically (Y). Since the infrared image is smaller, I will first tint the entire visible image blue, and then for every pixel in the infrared image, I will color the infrared pixels red, and the visible pixels green, so where they overlap, the pixels will be yellow (a perfect match between the two would have only pixels that are a shade of yellow). The first attempt can be seen below:
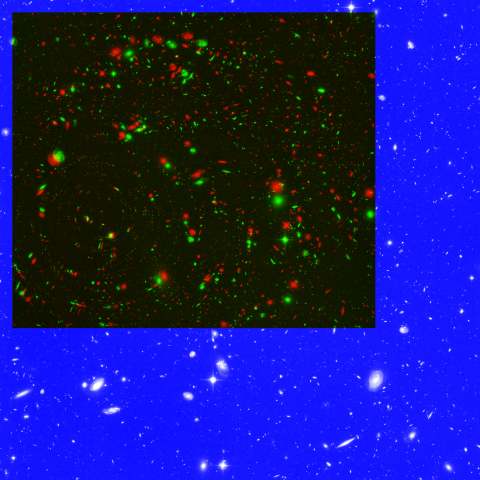
That seems pretty close, but the circular pattern you can see is due to something I was afraid of: the infrared image is rotated compared to the visible light image. After messing around for a while, I wrote some software to do a brute-force search for the offset and rotation at which the infrared image best matches the visible-light image. The best match, at least for the amount of processing I was willing to spend on finding it, is when the infrared image is rotated clockwise at 4.565°, with an X offset of 24 pixels and a Y offset of 37:
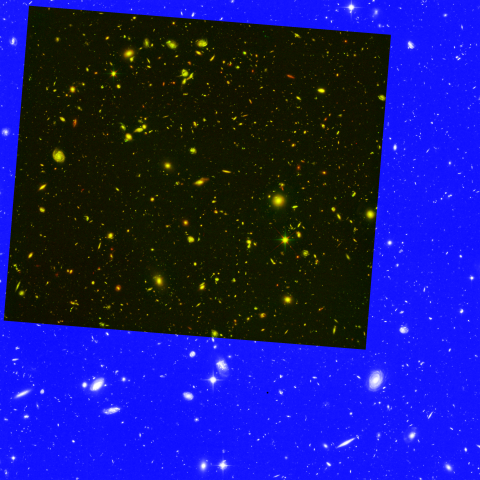
Already we can see some tantalizing red blobs in the comparison image, but some are obviously orange, meaning that those infrared blobs have corresponding visible blobs, making them probably not ultra-high redshift galaxies. The only blobs we’re really interested in are those for which the infrared is a lot more bright than the visible, and I had no interest in spending hours or days trying to visually confirm each and every blob on my own.
So, more software. This time, to compare the brightness of the infrared pixels to the brightness of the visible pixels. The simplest procedure, which just identifies those pixels which are the least little bit brighter in the infrared, wouldn’t work, because of the “haze” we can see throughout both images. A lot of that is just noise, but the problem is that within the haze, which pixels are brighter will essentially be random.
So, we should only consider pixels which are brighter in the infrared than in the visible by some significant amount. Too little a difference, and we wind up with zillions of candidates. Too much a difference, and we would see nothing. After some trial and error, a difference of 25% of the full brightness scale seemed to provide the best balance. A quick look at the results is below, where pixels for which the infrared is that much brighter than the visible are white, and all other pixels black:
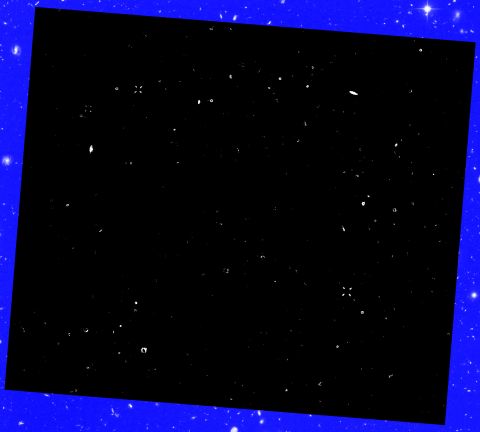
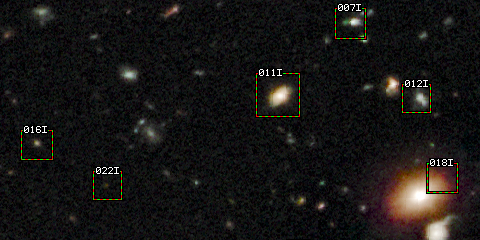
To better ensure that the candidates are more likely to show ultra-high redshift galaxies, because it appears that many of the visible-light galaxies have infrared “haloes” around them, I also had to examine the neighbors of the pixels that the previous operations had painted white. I wrote code to create bigger “blobs” of pixels around those that were clearly infrared-bright, and then only picked those for which the highest infrared brightness (within an entire blob) was greater than the highest visible brightness. I then wrote code to make nice rectangles around each candidate (or group of candidates if they were very close together), number them and create side-by-side comparison images which were greatly zoomed in.
The nine candidates (out of 254) which appear to most likely be ultra-high redshift galaxies are shown below:
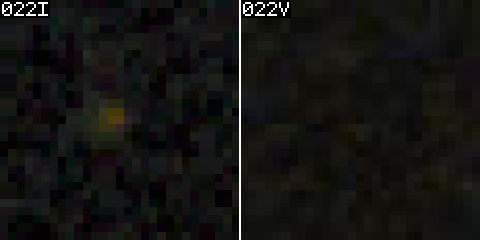
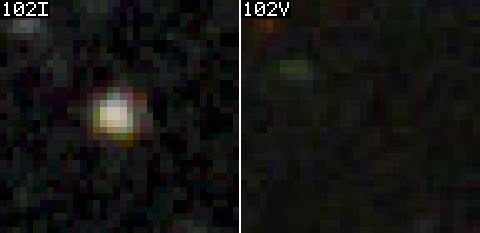
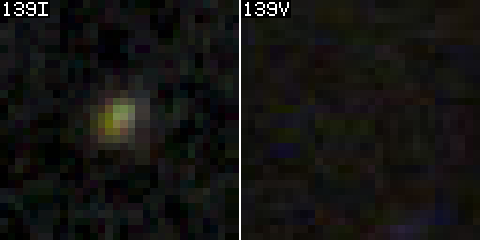
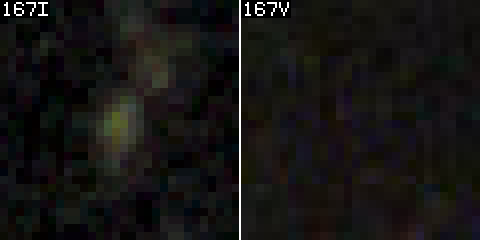
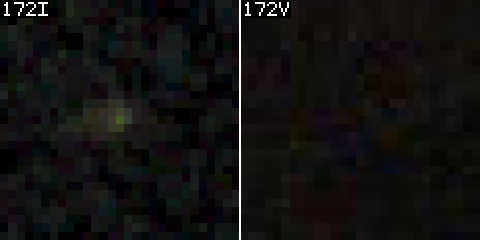
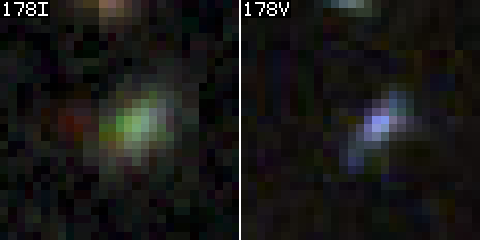
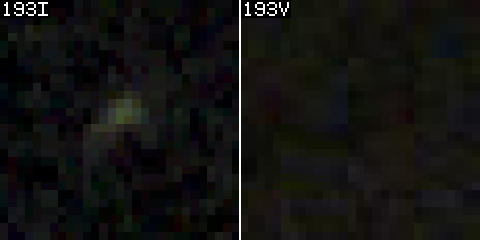
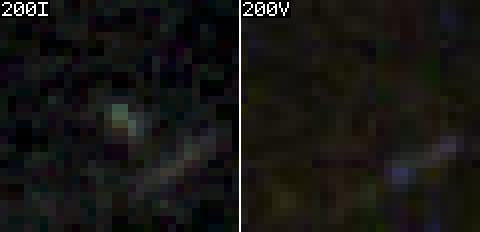
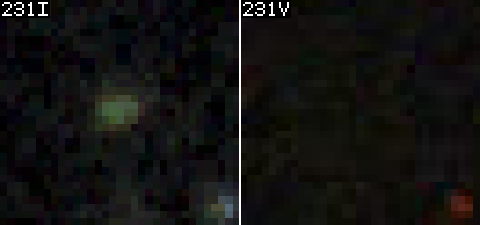
Another 33 candidates may represent very-high redshift galaxies, but they and the other 212 candidates are collected on another page. To find any of the candidates, click on the small section of the map of the candidates on the visible light image, below:
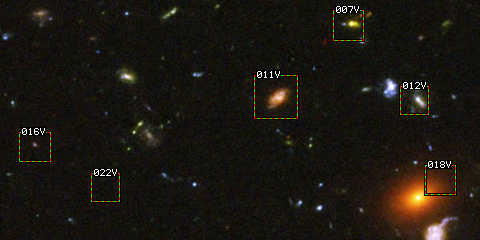
And below is the link to the map of all the candidates in infrared light:
